By Liam Dowd - September 23rd, 2014
Social media giving, digital marketing ad spending and social app access
The good and bad of social media
How does your corporation value its social media? It’s a question that is often asked by CMOs in particular. A new infographic from OutMarket gathers a number of key statistics to reveal what CMOs really think. Social media may grab much of a CMOs attention these days, but it is useful to place these networks into some form of context.
Corporations should also appreciate that social media networks are not a panacea for any marketing ills, but one powerful channel that needs to be integrated into a diverse yet focused message targeted at a well-defined audience.

Time in social media apps increases
Research from Localytics reveals apps continue to be a highly popular way for consumers to access social media. The key findings of the research include:
- Overall time in app has increased by 21%
- Users open an app on average 11.5 times a month, up from 9.4 a year ago (22% increase), while app session length has remained constant at 5.7 minutes
- Social Networking experiences strong “snacking” behaviour
- Music has the greatest time in app increase of 79%
- Time in Health and Fitness (a key feature in the recently announced iPhone 6) and Social Networking apps increased by 51% and 49% respectively
Localytics says: “Time in app is a function of the average session length and the average number of sessions for an app. While the length of individual app sessions has been relatively constant over the past year at 5.7 minutes, app launches have increased from 9.4 times a month to 11.5. This boost in app launches has driven a 21% increase in time in app.
“Social Networking apps exhibit “snacking” like behaviour with the highest number of app launches and lowest session length. Sports, Music, and News apps also exhibit a high number of app launches, likely due to the timeliness aspect of such apps.
“Despite reports that fewer apps are being downloaded each month, people are spending more time than ever in apps. Session length and app launches are important metrics to gauge app engagement, and together are an accurate representation of the amount of time users spend in apps. Time in apps have already surpassed desktop web, and as mobile apps incorporate even greater personalization features, this number is only expected to increase.”

Social giving
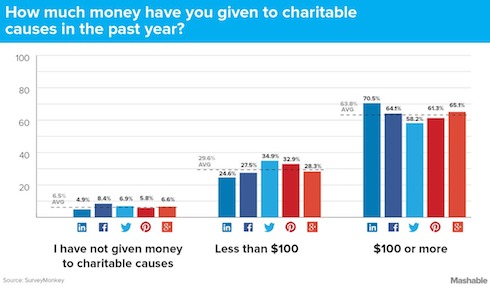
SurveyMonkey recently conducted an audience survey of over 1,000 US adults to discover their charitable giving. Over half (51%) of respondents hear about good causes first on social media, with 46% stating they hear about these causes first across their networks trumping TV and other broadcast media.
Turning to the actual donations made, 64% of those surveyed made a donation of $100 or more. Looking at the individual social media networks, LinkedIn is the most active in this area with less than 5% donating nothing to charities, with 70% stating they made a donation of $100 or more in the last year, with 64% of Facebook users giving a similar amount.
The propensity for LinkedIn users to donate more than on any other of leading social media platforms isn’t surprising, as according to Quantcast 40% of LinkedIn users have a household income of more than $100,000. This doesn’t however mean that your corporation should switch its charitable activity and marketing to LinkedIn, as less than 1% stated they discovered a charity or charitable activity via this network. It seems that when it comes to giving, multiple social media network marketing is vital.
Facebook dominates increased marketing spend
Facebook will continue to be the focus of corporate brand marketing spending through 2014 with a 50% increase in spending expected according to a new report from eMarketer. Focusing on the UK, the survey predicts that by 2016, 15% of all digital ad spending will be across social media networks. The forecast is that the UK will spend £7.25 billion this year up 15% on 2013.
The survey states that Facebook will take 7.5% of the ad revenue, with this increasing to a tenth over the next two years. Twitter by comparison will take 1.3% of the UK’s digital ad spend, but this will rise, as Twitter rolls out more ad targeted initiatives. The report also concluded that by 2016, marketers will be spending £36.49 per user across social media to reach their target audiences – a threefold increase since 2012.
In their study Duke University that also looked at marketing spend across social media also concluded that spending would increase with Duke University Fuqua School of Business Professor Christine Moorman, director of The CMO Survey, concluding: “If the same customer is being reached on and off the web with the same offerings and same brand, companies must ensure a high level of consistency between these efforts,” she said. “If not, customers will remain unconvinced how the company can meet their needs.”
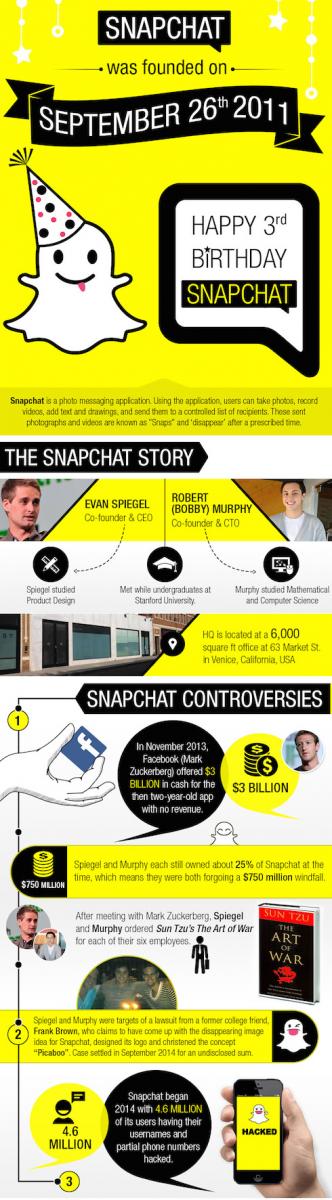
Happy birthday Snapchat!
The photo messaging service celebrates its third birthday this week. To mark the occassion, DPFOC have created an infographic showcasing the service's history and current usage.
Until next time….
The Useful Social Media team.
Next Reads
November 2014, New York
The Social Media for Customer Service Summit is your one-stop-shop for all the latest social media insight and best practice. It gives you a 360 degree look into building, operationalizing and initiating a successful social media strategy at your company
Brochure Programme